Department Backlog Chart Details
Department Backlog Chart Details
Overview
This article explains the department backlog bar chart, which visually represents job numbers at different locations, using color coding to indicate backlog status levels - critical, warning, healthy, and expedited. Users can subscribe to Backlog Alerts for notifications.
Instructions
The department backlog bar chart provides a visual representation of the current job numbers at various locations. The color-coded bars offer crucial insights into the backlog status.
Red bars represent a critical backlog situation at that specific location, requiring immediate attention.
Yellow bars represent a warning level, indicating that some backlog is present and should be addressed promptly.
Green bars represent healthy areas with no significant backlog concerns.
Orange bars represent locations where job numbers have been expedited, indicating proactive efforts to manage the backlog effectively.
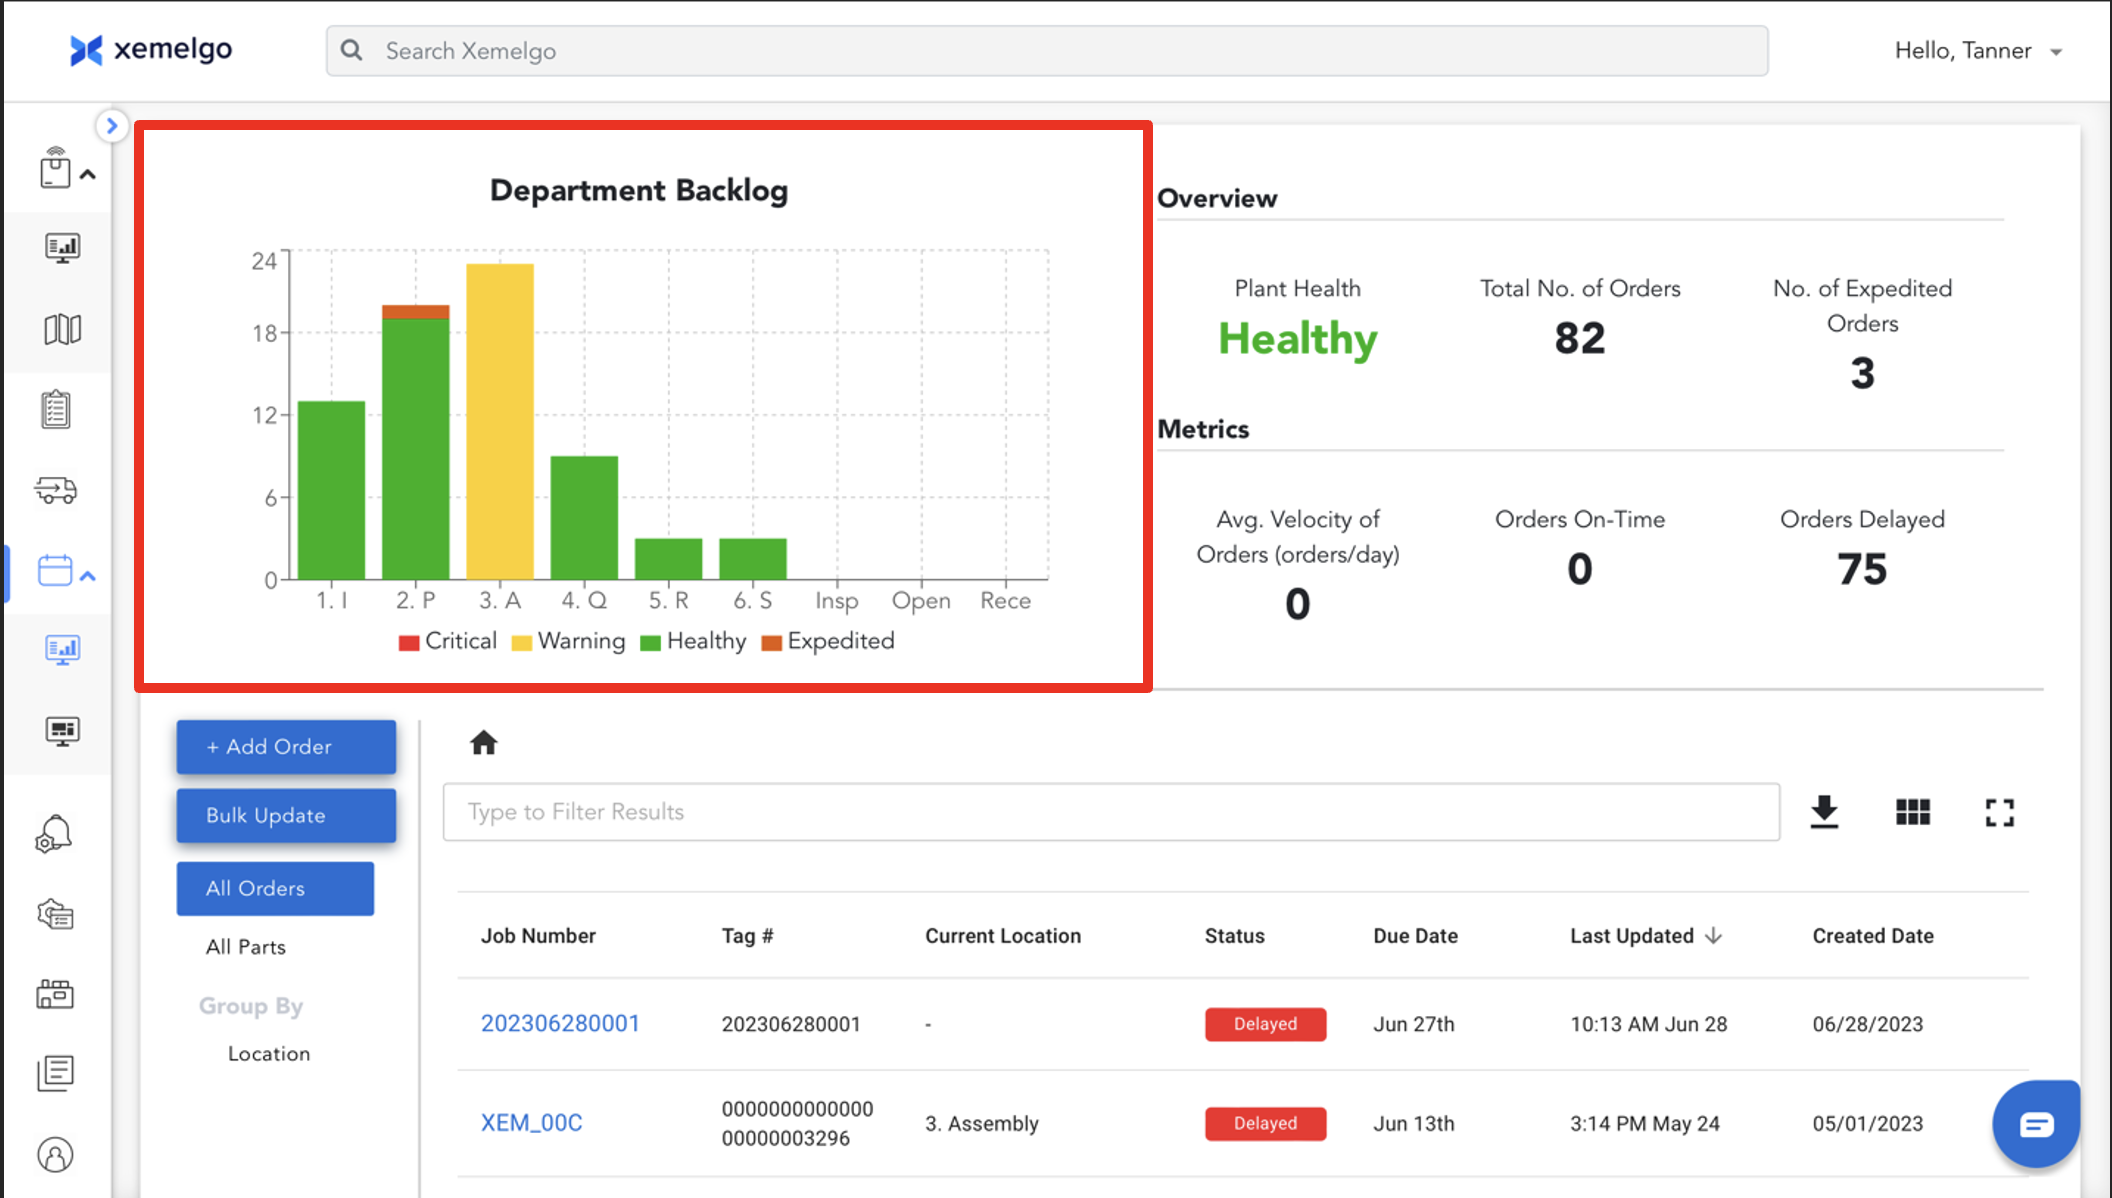
Users can subscribe to Backlog Alerts to receive a notification every time the backlog in a location exceeds the warning or critical thresholds.
Need further assistance?
The article above couldn't resolve your issue? Use the chat button in the bottom-right corner to contact the support team.